DATA - State-wise Gross State Domestic Product by Industry of Origin
(at 2004-05 Prices)
DATA REPRESENTATION - Actual figure in Rs. Crore at 2004-05 Constant Prices
CLICK HERE FOR DATA IN PDF FORMAT
SELECTION OF STATES - An attempt to choose a mix of relatively advanced and relatively backward states in India has been made. A few of the graphs graphs facilitate to have a closer look at the data for Chhattisgarh (CG).
SOURCE - Planning Commission, Government of India
WEBSITE - http://planningcommission.nic.in/data/datatable/0814/table_66.pdf (referenced on 17 SEP 2014)
CLICK HERE TO DOWNLOAD GRAPHS IN EXCEL SHEET FORMAT FROM OneDrive
CLICK HERE TO DOWNLOAD GRAPHS IN EXCEL SHEET FORMAT FROM Google Drive
CLICK ON THE GRAPHS FOR SLIDE SHOW VIEW
GRAPH -1
Service Component of GSDP by Industry of Origin at 2004-05 Prices

GRAPH -2
Industry Component of GSDP by Industry of Origin at 2004-05 Prices

GRAPH - 3
'Agriculture & Allied' Component of GSDP by Industry of Origin at 2004-05 Prices

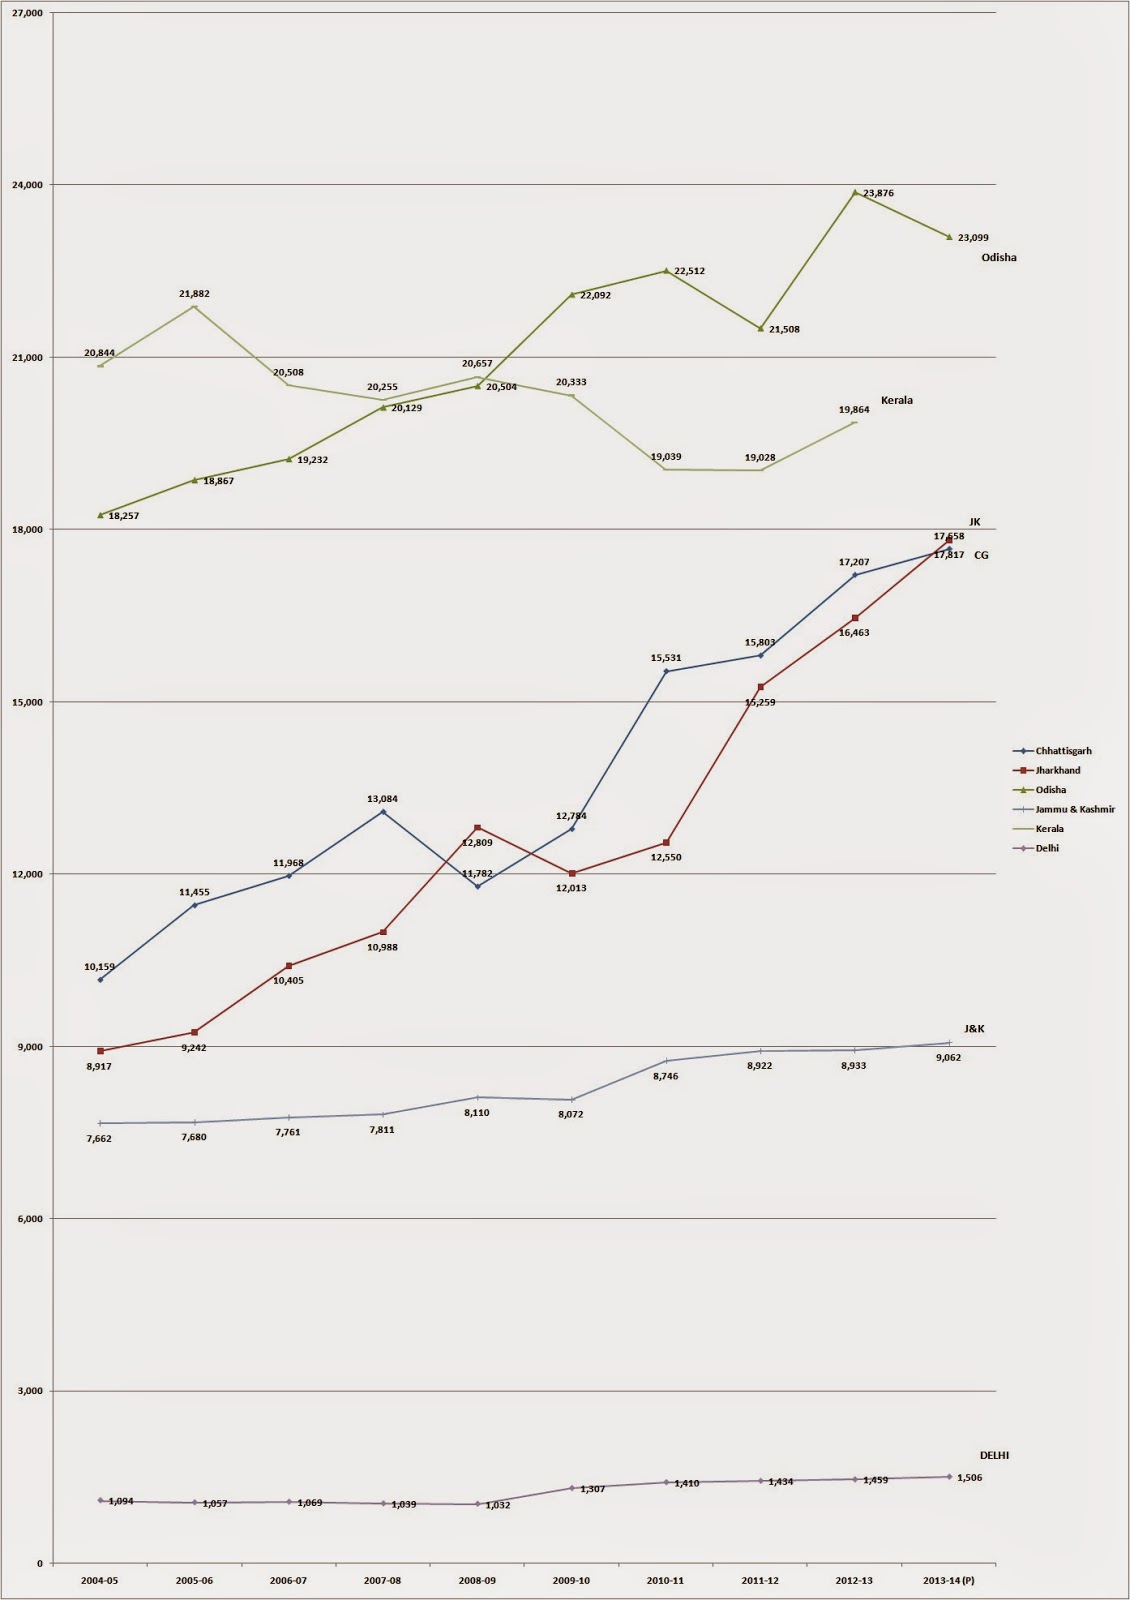
GRAPH -4

GRAPH - 5
Industry Component of GSDP by Industry of Origin at 2004-05 Prices (Less States for close analysis of states showing dynamics similar to that of CG)

GRAPH - 6
'Agriculture & Allied' Component of GSDP by Industry of Origin at 2004-05 Prices (Less States for close analysis of states showing dynamics similar to that of CG)
RELATED USEFUL DATA
GRAPH - 7
 |
| 2010 Percent labor employment in India by its economic sectors" by M Tracy Hunter - Own work. Licensed under Creative Commons Attribution-Share Alike 4.0 via Wikimedia Commons |
"2010 Percent labor employment in India by its economic sectors" by M Tracy Hunter - Own work. Licensed under Creative Commons Attribution-Share Alike 4.0 via Wikimedia Commons - http://commons.wikimedia.org/wiki/File:2010_Percent_labor_employment_in_India_by_its_economic_sectors.png#mediaviewer/File:2010_Percent_labor_employment_in_India_by_its_economic_sectors.png
GRAPH -8
 |
| India GDP without labels" by Tatiraju.rishabh at English Wikipedia - Own workData By MOSPI. Licensed under Creative Commons Zero, Public Domain Dedication via Wikimedia Commons |
"India GDP without labels" by Tatiraju.rishabh at English Wikipedia - Own workData By MOSPI. Licensed under Creative Commons Zero, Public Domain Dedication via Wikimedia Commons - http://commons.wikimedia.org/wiki/File:India_GDP_without_labels.PNG#mediaviewer/File:India_GDP_without_labels.PNG
GRAPH -9
 |
| 1951 to 2013 Trend Chart of Sector Share of Total GDP for each year, India" by M Tracy Hunter - Own work. Licensed under Creative Commons Attribution-Share Alike 4.0 via Wikimedia Commons |
"1951 to 2013 Trend Chart of Sector Share of Total GDP for each year, India" by M Tracy Hunter - Own work. Licensed under Creative Commons Attribution-Share Alike 4.0 via Wikimedia Commons - http://commons.wikimedia.org/wiki/File:1951_to_2013_Trend_Chart_of_Sector_Share_of_Total_GDP_for_each_year,_India.png#mediaviewer/File:1951_to_2013_Trend_Chart_of_Sector_Share_of_Total_GDP_for_each_year,_India.png
thank you so much for providing me with useful information
ReplyDelete